



Cursor Introduces /visualize to Turn Code and Data Into Visuals
Cursor's new /visualize command lets developers generate charts, plots and diagrams directly inside the Agents Window, making data analysis, system understanding and code reviews more visual without...

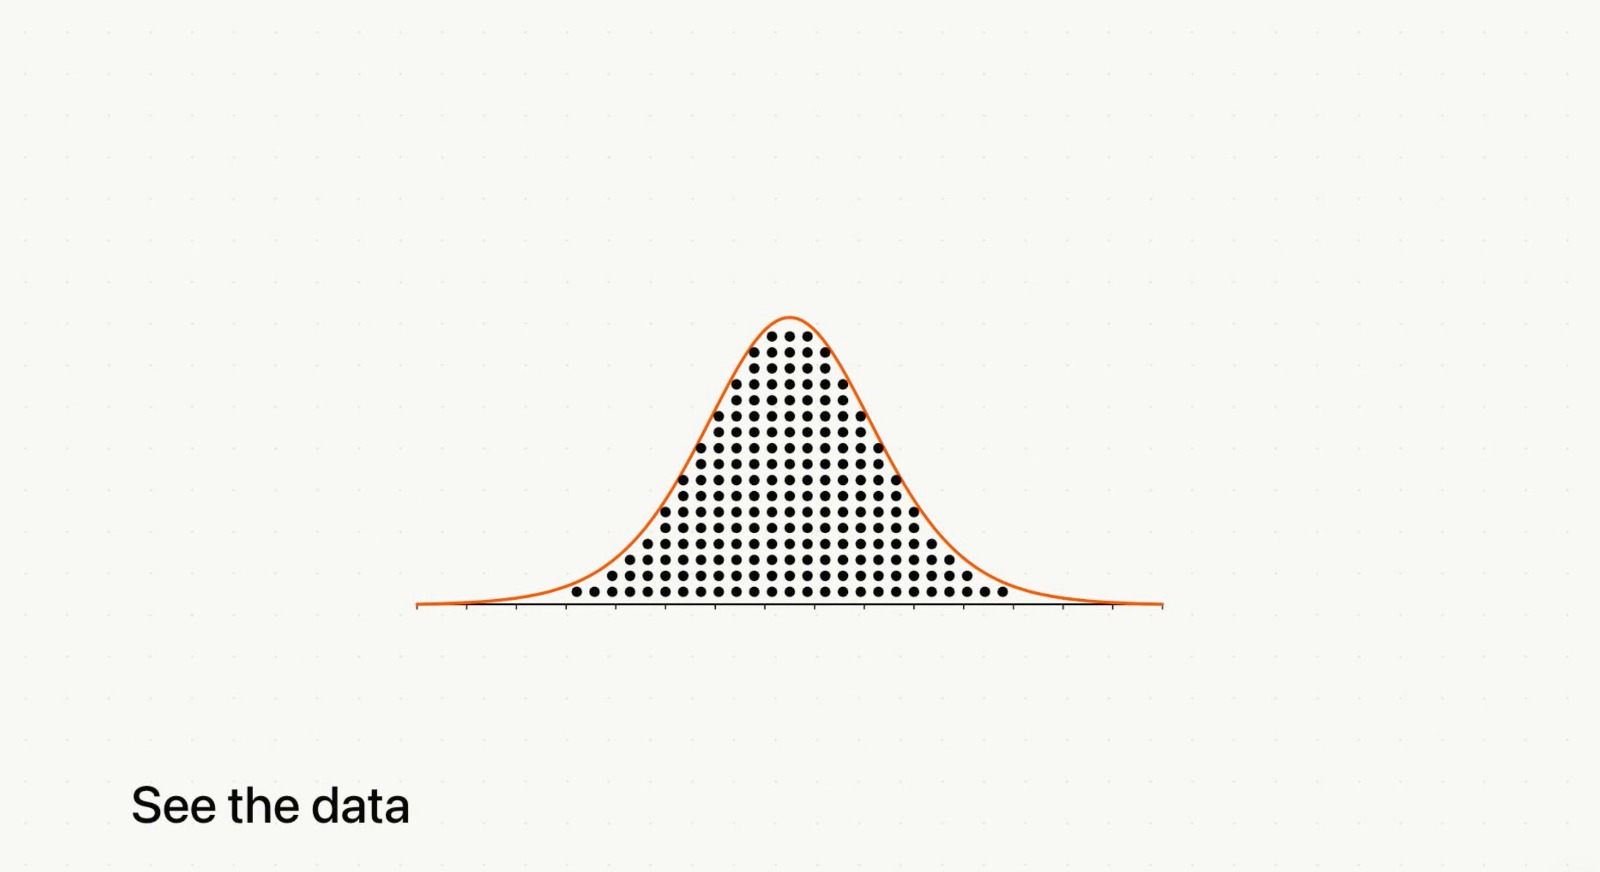
Cursor is making its AI-powered coding environment more visual with the introduction of the /visualize command. The new feature allows developers to ask Cursor’s Agent to turn information into charts, plots and diagrams directly inside the Agents Window.
Instead of leaving the coding environment to create a visualization separately, developers can use /visualize when working with data, code or technical explanations. This can make complex information easier to understand, particularly when a large amount of text or code needs to be translated into a visual representation.
The feature can be useful for a range of development tasks. Developers can create graphs to explore data, diagrams to explain system architecture or visual representations of relationships within a codebase. Mermaid-style diagrams can also help turn lengthy technical descriptions into easier-to-follow visual structures.
The addition builds on Cursor’s broader push toward visual development experiences, including tools such as Canvas, which provides a more visual way to work with AI-generated content and technical ideas.
Developer reactions highlighted in the announcement suggest that /visualize is already being used for everyday workflows, from quickly creating attractive graphs to wrapping up coding and review sessions with diagrams that summarize complex discussions.
For developers, the key advantage is convenience. Visualization becomes part of the same AI-assisted workflow instead of requiring separate tools, exports or manual chart creation.
The feature also reflects a wider trend in AI coding tools: agents are increasingly expected not only to write code but also to explain, analyze and communicate technical information visually.
Akash Takes: The real value of
/visualizeisn’t simply making prettier charts. It’s about reducing the gap between code, data and understanding. When an AI coding agent can turn a wall of text into a useful diagram instantly, developers can spend more time making decisions and less time formatting information.